Step-by-Step Guide to Debugging JavaScript Frontend Applications with IntelliJ
Recently, I learned that IntelliJ supports debugging JavaScript frontend applications. This article explains, step by step, how to use the debugger.
Prerequisites
This article assumes that you have a Javascript frontend application which has a script to run the Javascript application and IntelliJ Ultimate is installed. I guess that Webstorm also comes with the necessary plugins “Javascript and TypeScript” and ”JavaScript Debugger“.
Configuring IntelliJ for JavaScript Debugging
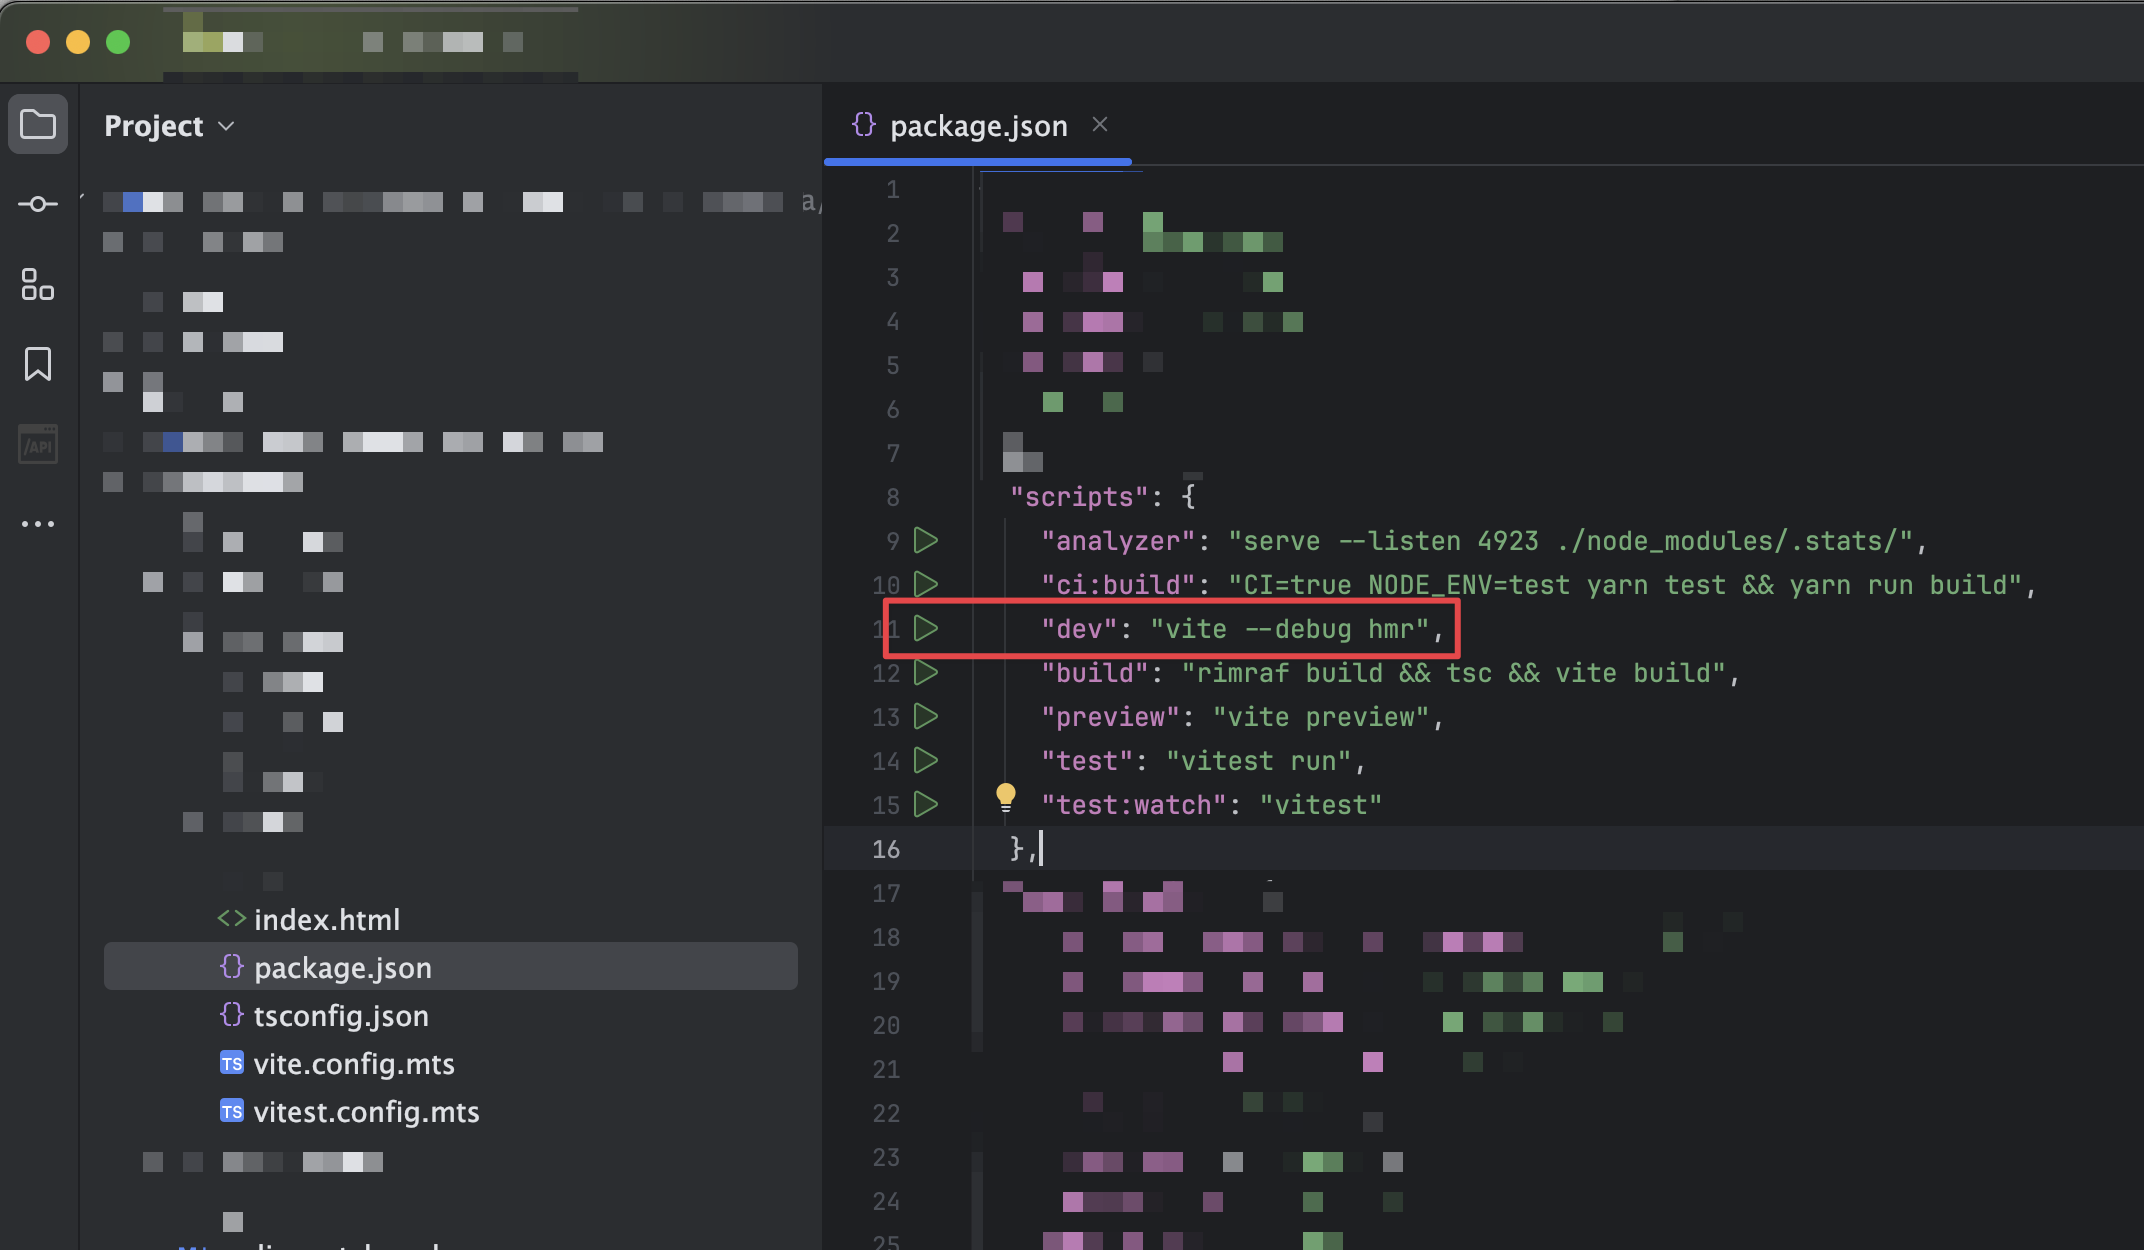
First, ensure you can start your application from within IntelliJ. Open your project’s package.json and start the application:
Upon successful start, configure the debugger in IntelliJ. Navigate to “Run - Edit Configurations” under the Run Configurations menu:
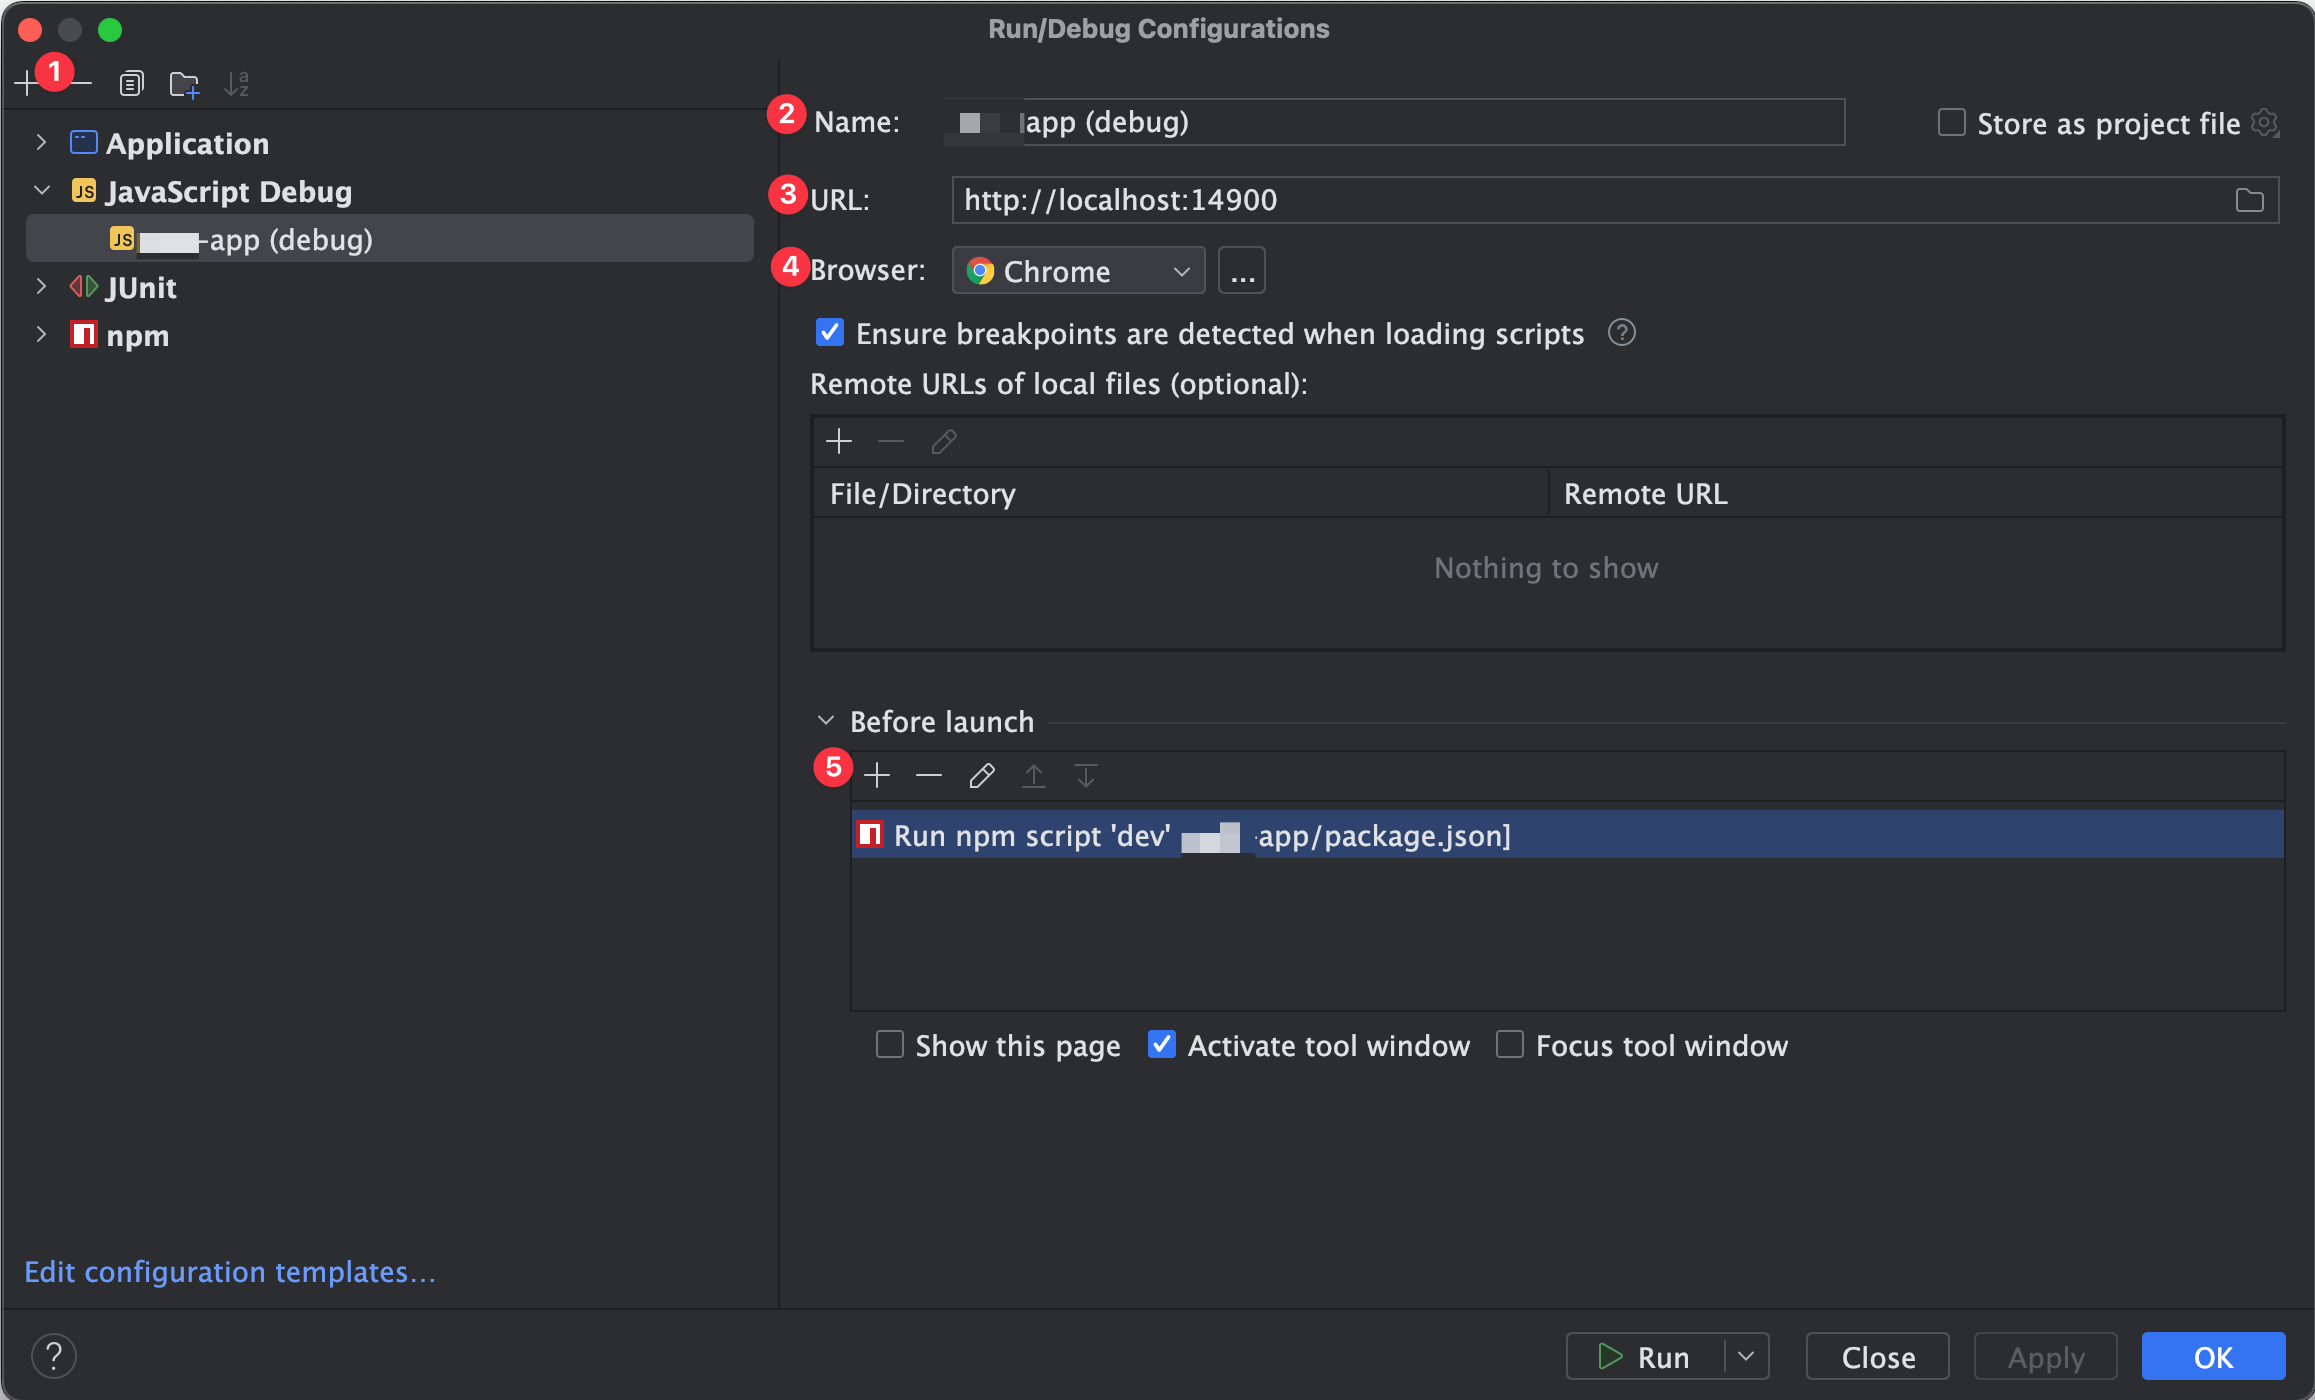
- Add a new configuration
- Set the name
- Choose a URL
- Choose Chrome or Chromium as browser (others are not supported)
- Add the start script of your application
To configure your application’s script:
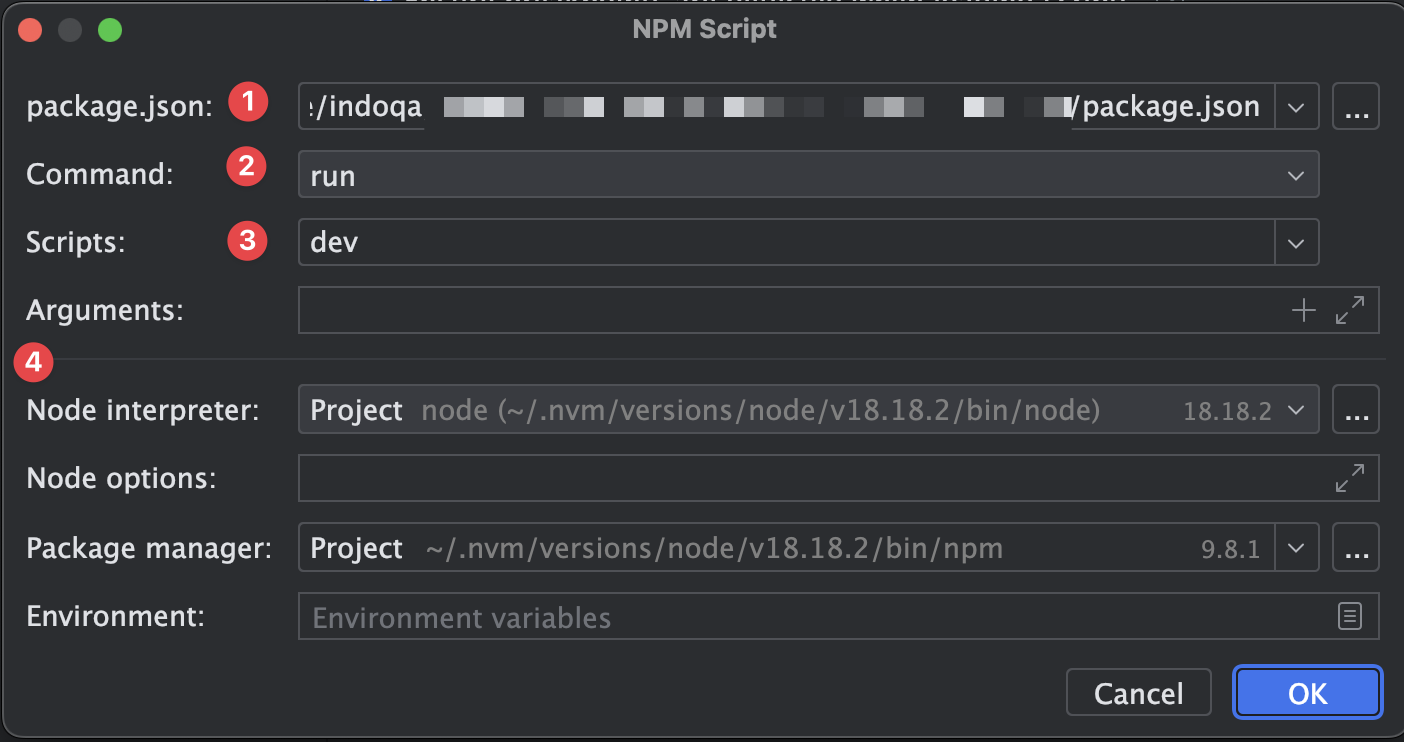
- Choose the package.json that contains the script to run your application
- Choose “Run”
- Choose the script that runs your application
- Check the other environment settings (IntelliJ chooses sensible defaults)
Finally, initiate the Debug configuration by selecting the “Run” icon (not “Debug”) and examine the debug output:
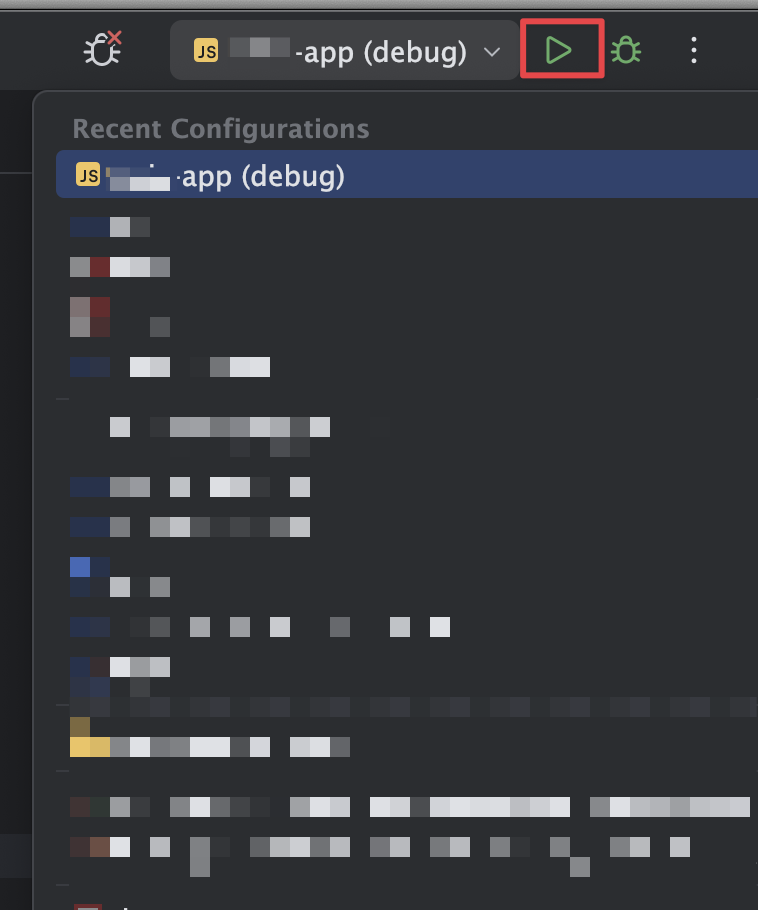
This will open the Debug console and start a browser window. Now, you can set breakpoints in IntelliJ and inspect the execution stack by selecting “Threads and Variables.”
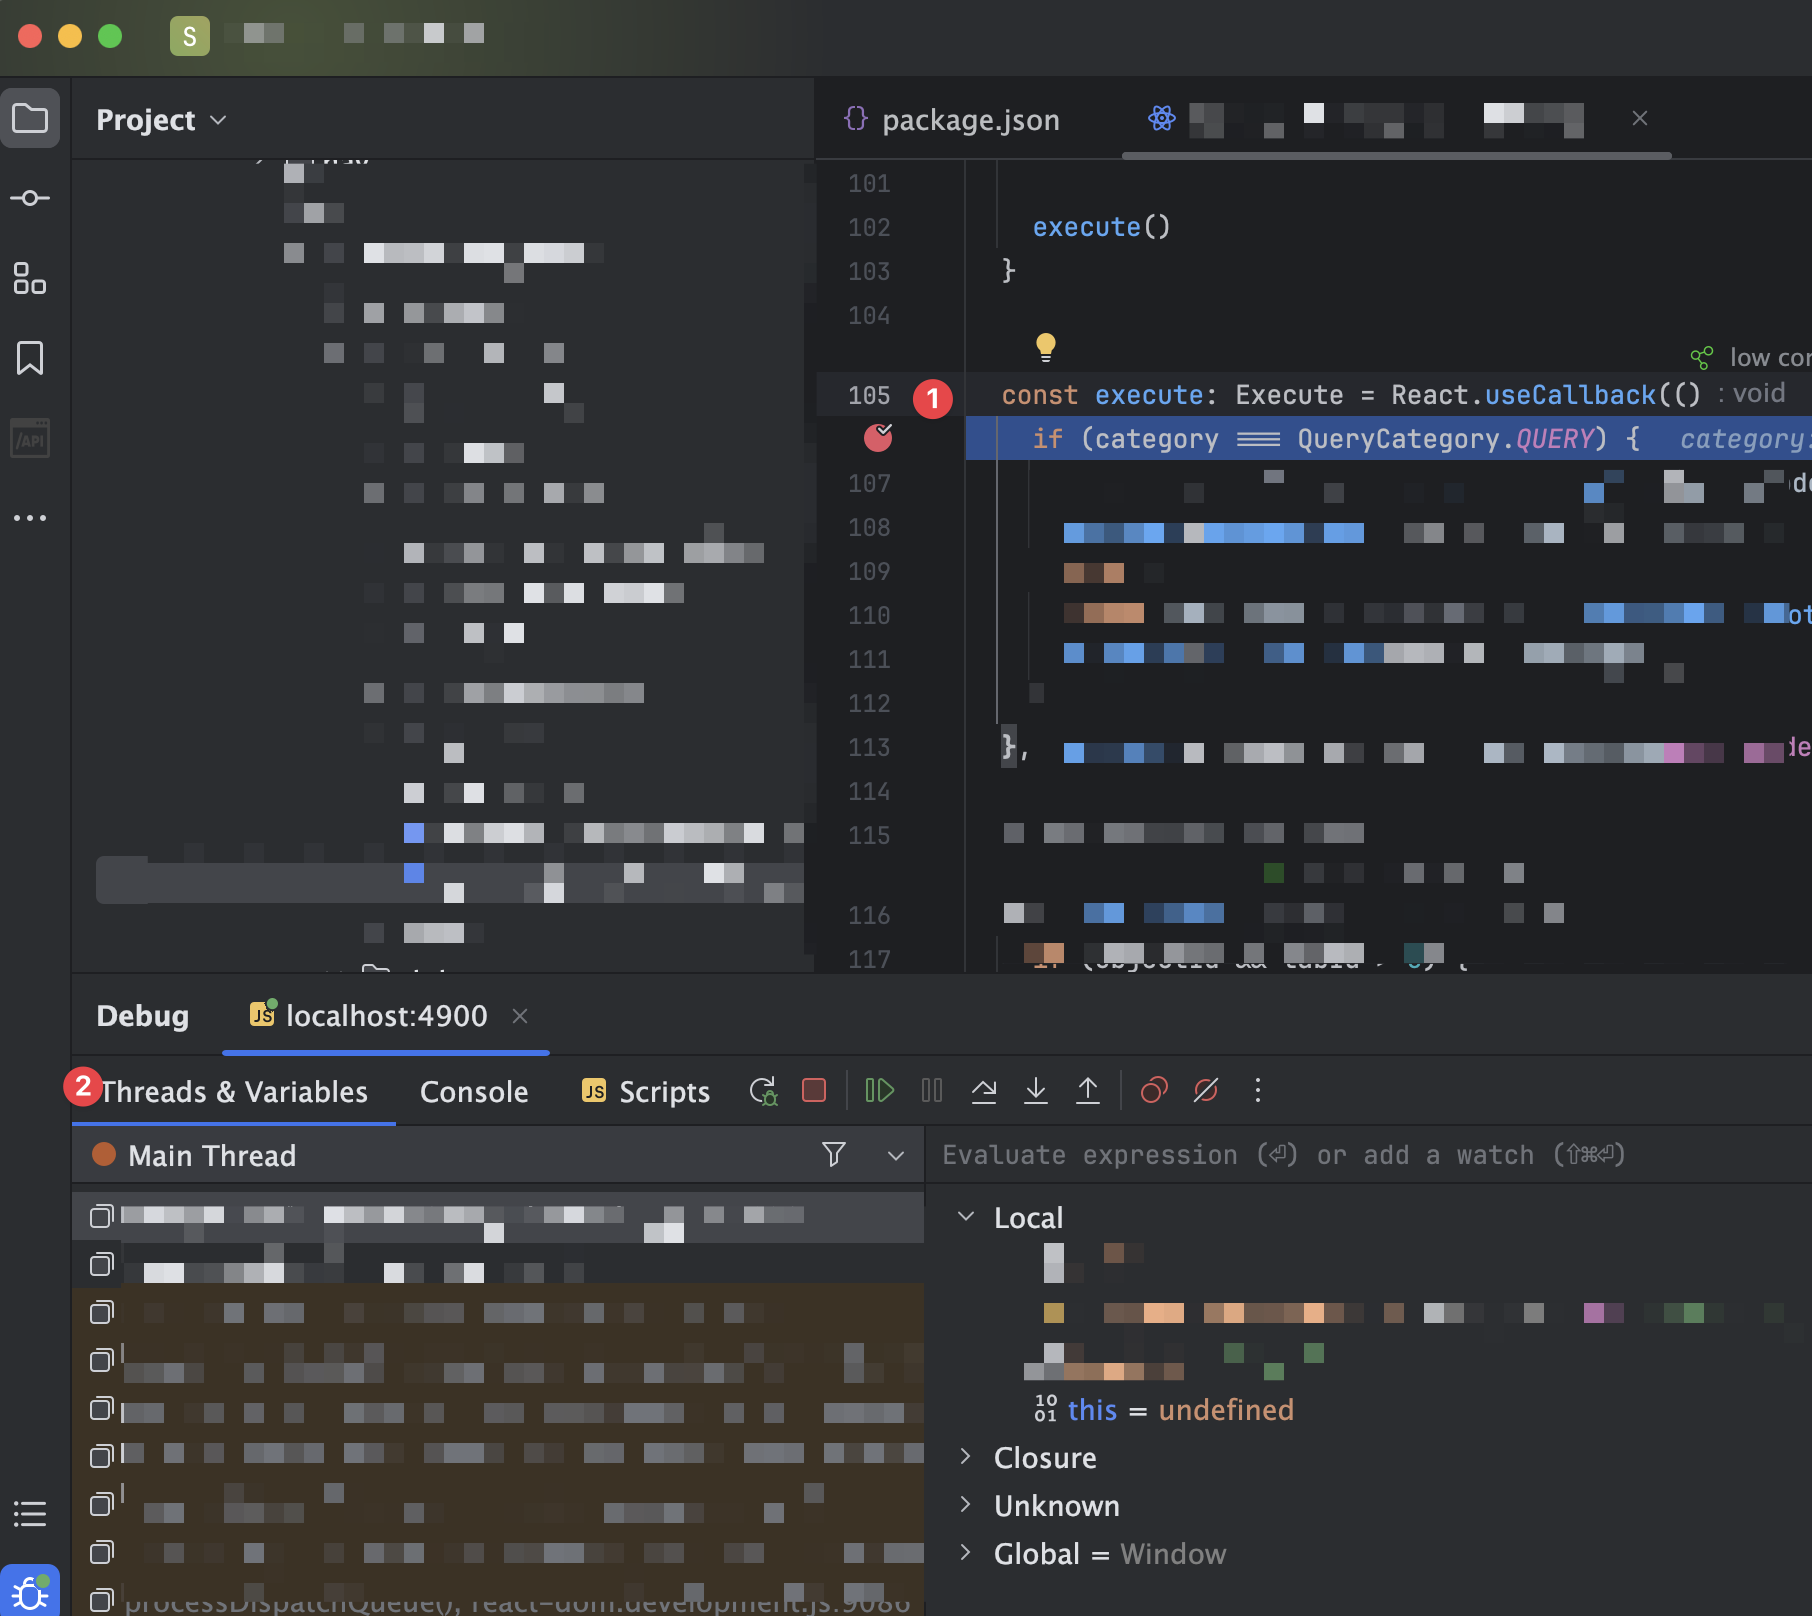
- Set breakpoints
- Select “Threads and Variables” to inspect your application.